
Let’s be honest—most of us have been trapped inside the world of boring spreadsheets. You open Excel or Google Sheets, gather your data, and do all the hard work, but when you try to create a chart, you end up with something that looks like it came straight out of the early 2000s. It’s flat, static, and just plain uninspiring.
If you’re a marketer, a consultant, or a small business owner trying to get your clients to pay attention, you know that these outdated visuals don’t do you any favors.
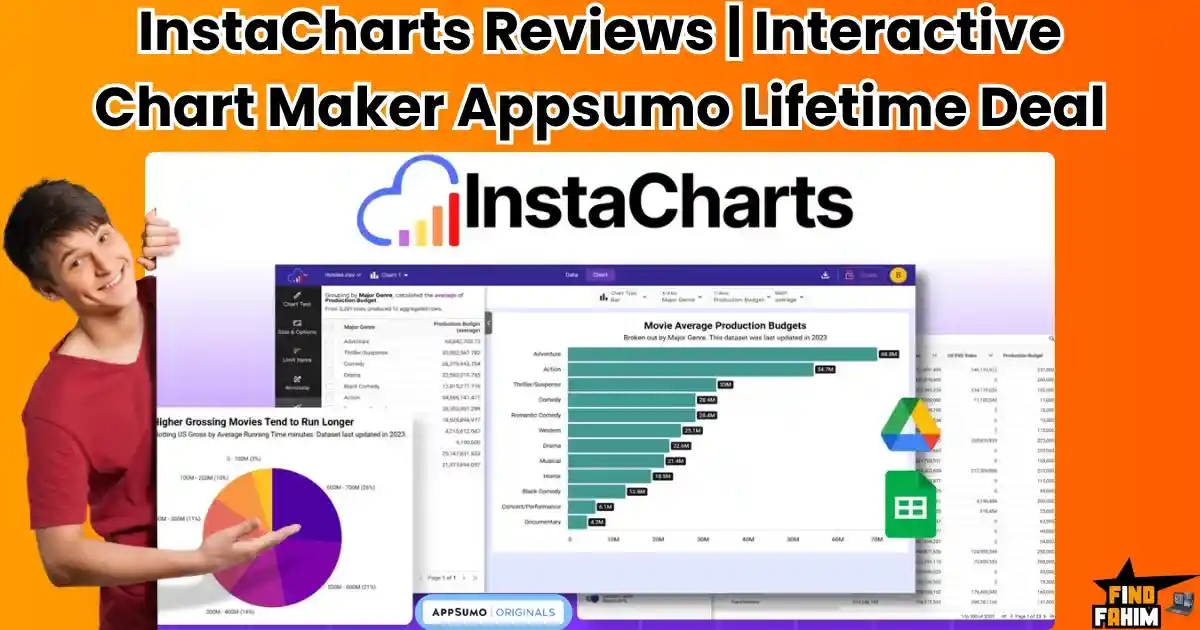
That’s where InstaCharts caught my eye. I first discovered it while browsing AppSumo, where I’ve picked up many tools that have helped me save money and ditch the stress of monthly fees. And honestly, this one stood out. For just $29 one time, InstaCharts gives you lifetime access to an instant chart-making tool that turns your raw data into beautiful, interactive, and shareable visuals—in seconds. In this InstaCharts reviews, I’ll walk you through how it works, what makes it special, and why I believe this AppSumo lifetime deal is one of the smartest picks you can grab right now.
What is InstaCharts? The Instant Chart-Maker Explained
At its core, InstaCharts is an AI-powered chart-making tool designed for individuals who don’t have hours to waste tweaking Excel graphs or learning complex software like Tableau. You connect your data — whether it’s from Google Sheets, Excel, or a CSV file — and InstaCharts instantly suggests the best chart type to visualize it. From there, you can customize, share, or embed it wherever you need.
The tool is designed for a wide range of users:
- Marketers who need quick, clean visuals for campaigns.
- Consultants who turn spreadsheets into client-ready reports.
- Educators who want to make data more engaging for students.
- Small business owners who need to track numbers without hiring a data analyst.
What really makes it stand out is how approachable it feels. You don’t need to be a “data person” to get results. In fact, the tool’s whole mission is to make professional data storytelling simple, fast, and stress-free. If you can upload a file or connect a Google Sheet, you can use InstaCharts.
Why Spreadsheets Alone Are Not Enough
Now, don’t get me wrong — spreadsheets are powerful. But when it comes to actually communicating insights, they fall short. Charts in Excel or Google Sheets are often clunky, generic, and static. They work fine for quick in-house use, but they don’t impress clients, and they definitely don’t keep an audience engaged.
Another issue? Time. Formatting and customizing charts in spreadsheets can take ages. And even after all that effort, you’re stuck with visuals that don’t look modern or interactive. In a world where attention spans are short, sending over a lifeless pie chart isn’t going to make your point stick.
This is where a dedicated tool like InstaCharts saves the day. By focusing 100% on visualization, it eliminates the friction and helps you go from raw data to polished, interactive charts in seconds. That’s a huge difference when you’re under pressure to deliver insights quickly and professionally.
Why InstaCharts Reviews is Trending in 2025
There’s a bigger story here: data visualization is exploding. We’re living in the no-code, AI-powered era where people want tools that work fast, look great, and don’t require technical skills.
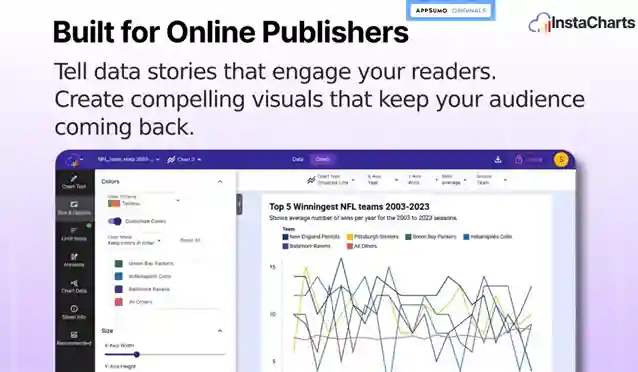
InstaCharts sits right at the center of that trend. It makes pro-level charting accessible to everyday users, not just data analysts. Marketers and consultants, in particular, are leaning heavily on interactive visuals because they make content more engaging and help build trust with clients.
Another reason it’s buzzing? The AppSumo lifetime deal. Normally, tools like this would cost you a recurring monthly subscription — sometimes $50, $100, or more. But for a single $29 payment, InstaCharts is giving lifetime access. That’s a huge attraction for freelancers, SMBs, and creators who are tired of ongoing bills. It’s not just about saving money; it’s about peace of mind knowing you’ve secured a tool for good.
Inside InstaCharts: Key Features & Benefits
So what exactly do you get when you use InstaCharts? Here’s a closer look at its standout features and why they matter in real life:
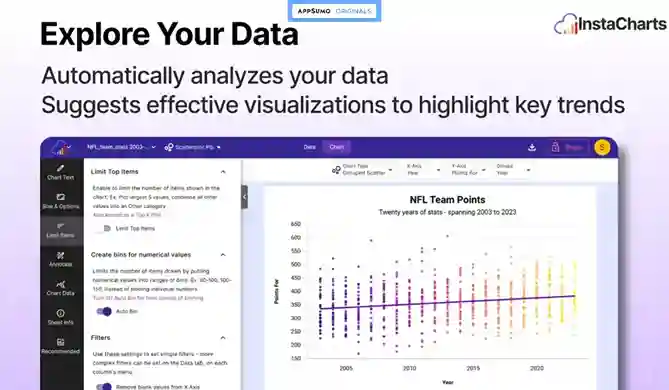
- Smart Visual Suggestions
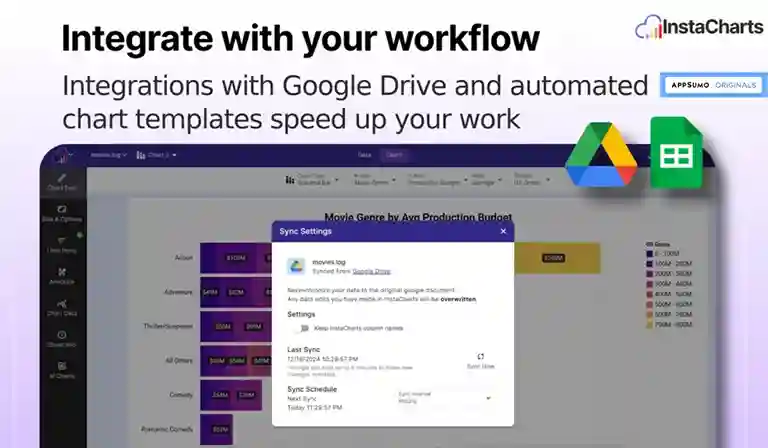
Upload your data, and InstaCharts instantly suggests the best chart type to represent it. No more guessing whether a bar chart, line chart, or scatter plot will tell your story best. - Auto-Updates from Google Sheets
You can connect live Google Sheets and have your charts update automatically on an hourly, daily, or monthly basis. Imagine creating a client dashboard once and never touching it again — the data just refreshes itself. - Interactive Charts & Tables
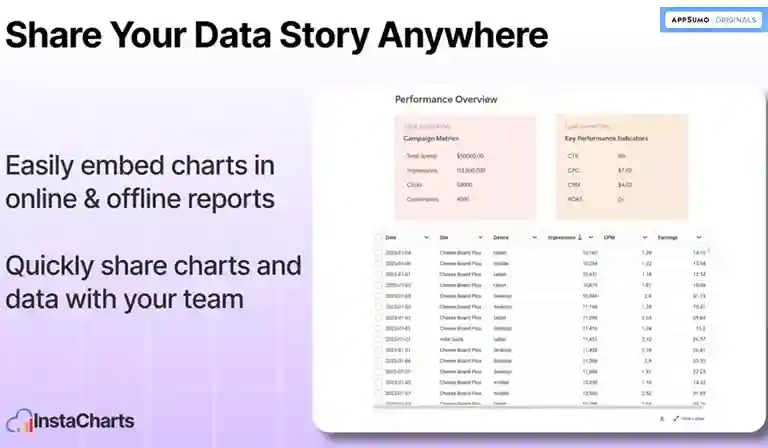
Unlike static images from Excel, InstaCharts charts are interactive. Clients and viewers can hover, click, and explore, making your reports more engaging. - Easy Embedding Anywhere
With simple embed codes, you can drop charts into WordPress blogs, Notion docs, Substack newsletters, or even Slack. Perfect for anyone building content or reports online. - Real-World Scenarios
- A consultant can turn messy revenue spreadsheets into sleek dashboards for clients.
- A marketer can embed live campaign performance charts into a Notion workspace.
- A blogger can add dynamic data visuals into an article to make it more credible and shareable.
The bottom line? InstaCharts doesn’t just make charts look pretty. It saves time, removes complexity, and adds an interactive edge that helps your work stand out.
The Standout Feature: True Instant Chart Creation
Every tool claims to “save you time,” but InstaCharts actually delivers on that promise. The real magic moment happens the second you connect your spreadsheet. Within seconds, the platform automatically suggests the most suitable chart type and builds it for you. No dragging, no fiddling, no endless formatting.
Compare that with Canva or Google Sheets. Canva is great for design, but making charts there still feels like a manual process. Google Sheets, meanwhile, will give you a chart instantly — but it often looks outdated and needs a lot of work before it’s client-ready. InstaCharts skips those frustrations by giving you beautiful, interactive visuals immediately. That instant transformation from raw numbers to polished visuals is what makes users fall in love with it.
How Does InstaCharts Work? (Quick Walkthrough)
One of the reasons I recommend InstaCharts is because it’s shockingly beginner-friendly. You don’t need to be a data expert or designer to get results. The workflow can be broken down into three simple steps:
- Connect Your Data – Upload a CSV, Excel file, or link a live Google Sheet.
- AI Suggests the Best Chart – The system automatically picks the most suitable visualization type for your data.
- Embed or Share Instantly – Copy an embed code to drop it into WordPress, Notion, Substack, or even share the chart link directly.
That’s it. No complicated menus, no coding, no learning curve nightmares.
And if you do want a little extra help? InstaCharts has a growing set of YouTube tutorials that guide you through use cases step by step. It’s the kind of tool where you can get value in under five minutes — but still grow into it over time.
Pricing & AppSumo Deal Details
Here’s where InstaCharts really shines. Instead of paying monthly fees, you can grab it on AppSumo as a lifetime deal starting at just $29 one time. That’s less than what some other tools charge for a single month.
The deal is structured across two main tiers:
| Tier | Price (one-time) | Monthly Views | Storage | Max Rows | Watermark | Export |
| Tier 1 | $29 | Buy Now | 1,000 views/month | 100 MB | 25,000 | Removed | ✅ |
| Tier 2 | $58 | Buy Now | 100,000 views/month | 500 MB | 100,000 | Removed | ✅ |
A few key things to know:
- Stackable Codes: You can stack multiple codes if you need more capacity. For example, buying two Tier 1 codes gives you extra views and storage.
- Best Value: Tier 2 is by far the sweet spot for most users, offering 100x more views for just double the price.
- Refund Policy: As with all AppSumo deals, you get a 60-day no-questions-asked refund. Try it risk-free.
👉 Don’t forget to check out my hot trending AppSumo lifetime deals personally hand-picked by me if you’re serious about saving money and building your stack of powerful tools.
Pros & Cons of This Lifetime Package
Like every tool, InstaCharts has its strengths and small trade-offs. Let’s look at both sides:
Pros
- Ease of Use – Zero learning curve; anyone can make a chart in minutes.
- Instant AI Charting – Truly saves hours compared to Canva or Sheets.
- Google Sheets Integration – Live auto-updates keep your charts fresh.
- Lifetime Value – Pay once and never worry about ongoing subscriptions.
- Client-Friendly – Embeddable, interactive charts make reports look pro.
- Strong Founder Support – Quick responses, YouTube tutorials, and roadmap improvements.
Cons
- Honestly, the only real drawback is that the AppSumo deal won’t last forever. If you miss it, you’ll likely end up paying recurring monthly fees later. It’s the kind of tool that you’ll want long-term, so grabbing the lifetime package while it’s available is the smart move.
In other words, the “cons” here aren’t about the tool itself — they’re about the risk of waiting too long and missing a deal that could save you hundreds or even thousands in subscription fees down the line.
Best Use Cases for InstaCharts
The beauty of InstaCharts is how flexible it is. Here are some of the best real-world scenarios where it shines:
- Marketers – Need to show campaign performance? Build live dashboards that auto-update from Google Sheets and embed them into reports or client portals. Instead of sending dull spreadsheets, you’ll impress clients with visuals that tell the story.
- Consultants – If you’re analyzing revenue, operations, or customer data, InstaCharts lets you turn those raw tables into professional visuals instantly. Your clients don’t just see numbers; they see trends, patterns, and clear stories.
- Content Creators & Bloggers – Adding charts to an article boosts credibility and keeps readers engaged. Instead of static images, you can embed interactive visuals that make your posts stand out on Google.
- Educators – Whether it’s a classroom demo or an online course, InstaCharts helps you bring data to life. Students can interact with charts and understand complex concepts faster.
At the end of the day, this tool is about making data communication effortless. If you deal with numbers in any capacity, InstaCharts helps you present them in a way that’s not only professional but also memorable.
InstaCharts vs Competitors
When considering a new tool, it’s smart to look at the alternatives. Every platform has strengths, but the real question is: does InstaCharts bring something unique to the table? By comparing it to well-known options like Google Sheets, Canva, Infogram, Flourish, and Datawrapper, we can see where it stands out and where it might fall short. This comparison helps you decide if InstaCharts is the right fit for your workflow — whether you’re a marketer, educator, consultant, or content creator. Let’s break it down competitor by competitor.
InstaCharts vs Google Sheets
Google Sheets is the default chart-making option for most people. It’s free, reliable, and connected to your existing data. However, creating charts inside Sheets often feels clunky. The visuals are functional but outdated, and customizing them for client presentations can take a lot of time. Sharing them is also limited — you’re usually just sending over a spreadsheet or a static chart.
In contrast, InstaCharts transforms the same data into clean, modern visuals instantly. It also supports live auto-updates, so your embedded charts always reflect the latest numbers without you having to manually refresh. While Google Sheets wins for data storage and formulas, InstaCharts wins for presentation and interactivity. For professionals who want their reports and dashboards to look polished without extra effort, InstaCharts is a far better choice.
InstaCharts vs Canva
Canva is a powerhouse for design — it’s great for creating social posts, infographics, and marketing visuals. You can also make charts in Canva, but here’s the catch: they’re static. Once you publish, those charts don’t update with new data. If you need to change a number, you’re back in Canva manually editing it again.
InstaCharts, on the other hand, is designed for data-first storytelling. Charts auto-update when the connected spreadsheet changes, meaning your dashboards stay fresh without extra work. Canva’s strength is branding and layout, but InstaCharts specializes in interactive, embeddable charts that you can drop into blogs, reports, or dashboards. If you’re after automation and real-time insights, InstaCharts is the clear winner.
InstaCharts vs Infogram
Infogram has long been one of the top tools for making polished, professional infographics and charts. Its library of templates is impressive, and the final output looks beautiful. But the catch is the price: Infogram costs upwards of $79 per month for pro features. That adds up fast — nearly $1,000 a year.
This is where InstaCharts really disrupts the market. For just $29 one time on AppSumo, you get lifetime access with no recurring fees. The design might not have as many templates as Infogram, but for small businesses, consultants, and educators, InstaCharts gives you 80% of what you need at less than 5% of the cost. Unless you have enterprise-level design demands, InstaCharts is the more sensible, budget-friendly option.
InstaCharts vs Flourish
Flourish is a well-known platform in the data visualization world, especially for enterprise use. It offers advanced customization, complex chart types, and powerful integrations. However, it’s primarily geared toward large organizations with big budgets. Plans often run into hundreds per month, which is overkill for most small teams and solopreneurs.
InstaCharts fills that gap by providing accessible, affordable visualization tools. While Flourish might win for enterprise-level complexity, InstaCharts is the better choice for everyday professionals who just need to make data look good quickly. With its AppSumo lifetime deal, you’re paying once instead of committing to ongoing high costs. For non-enterprise users, InstaCharts is an easy pick.
InstaCharts vs Datawrapper
Datawrapper is trusted by major newsrooms and enterprises for professional-grade charts and maps. Its visual quality is top-notch, and it’s designed for organizations handling large datasets. But the reality is that Datawrapper costs around $500/month for team licenses — far beyond what most startups, freelancers, or small agencies can justify.
InstaCharts takes a very different approach. It’s not trying to compete with heavy enterprise solutions. Instead, it focuses on simplicity, affordability, and accessibility. For just $29, you get a tool that may not replace a $500/month newsroom-level platform but gives you more than enough firepower for reports, blogs, client dashboards, and teaching materials. It democratizes charting for anyone who doesn’t have a corporate budget.
Competitor Comparison Table
Here’s a quick breakdown of how InstaCharts stacks up against the competition:
| Tool | Pricing | Chart Type | Interactivity | Auto-Updates | Best For |
| InstaCharts | $29 one-time (lifetime) | Core chart types | ✅ Yes | ✅ Yes (Google Sheets live) | Marketers, consultants, educators, bloggers |
| Google Sheets | Free | Basic charts | ❌ No | ❌ Limited | Data storage & formulas |
| Canva | $12.99/mo+ | Design-first charts | ❌ No | ❌ No | Branding & social media graphics |
| Infogram | $79/mo+ | Polished charts & infographics | ✅ Yes | ✅ Limited | Enterprises & designers |
| Flourish | Custom/Enterprise pricing | Advanced visualizations | ✅ Yes | ✅ Yes | Big orgs, media companies |
| Datawrapper | $500/mo+ (teams) | Professional charts & maps | ✅ Yes | ✅ Yes | Newsrooms, enterprise reporting |
From this table, you can see the unique position of InstaCharts: it delivers the essentials of interactivity and live updates at a fraction of the cost.
Is This Lifetime Deal a Smart Business Investment?
The short answer: yes, absolutely. Let’s do a quick ROI check. Suppose you buy Tier 1 at $29. That’s the cost of a single dinner. Now imagine you save just 2–3 hours a month by not fiddling around with Google Sheets or Canva to format charts. Over the course of a year, that’s 24–36 hours saved. If your billable rate is even $25/hour, that’s $600–$900 in value for a $29 purchase.
And that’s just time savings. Add the client impact of delivering modern, interactive dashboards that impress and retain customers, and the value multiplies. For educators, the ROI is in engagement; for marketers, it’s in conversions; for consultants, it’s in credibility.
Unlike monthly tools that quietly drain your budget, InstaCharts is a set-it-and-forget-it asset. You pay once, lock in the features, and use it for years without worrying about rising subscription costs. For anyone who works with data even occasionally, it’s one of the smartest small investments you can make in 2025.
How to Redeem the InstaCharts AppSumo Deal
Grabbing InstaCharts on AppSumo is quick and painless. Here’s the step-by-step:
- Visit the InstaCharts AppSumo deal page.
- Select your preferred tier (I personally recommend Tier 2 for the extra room to grow).
- Complete the one-time checkout — no hidden upsells, no monthly traps.
- You’ll instantly get a code in your AppSumo account.
- Redeem that code on InstaCharts’ official site, create your account, and start making charts right away.
And don’t forget, AppSumo backs all lifetime deals with a 60-day refund guarantee. That means you can test-drive InstaCharts for a full two months, risk-free.
👉 Want more gems like this? Check my email marketing, lead generation, or AI tool category to get the latest deal.
Final Verdict: Is This Cost-Friendly Deal Worth It?
If you’ve ever spent too much time formatting clunky charts in Google Sheets or re-editing static graphics in Canva, InstaCharts feels like a lifesaver. It’s built for busy professionals who want beautiful, interactive, and always up-to-date charts without hassle.
The $29 Tier 1 option is already a steal, but for most users, Tier 2 delivers the best long-term value with more rows, storage, and scalability. It’s still cheaper than one month of Infogram or Datawrapper.
What I love most is that InstaCharts isn’t trying to be everything. It’s simple, focused, and solves a clear problem: turning your raw data into visuals that actually engage.
If you work with clients, teach, blog, or consult, this is one of those rare tools that keeps paying you back over time.
Grab the InstaCharts Lifetime Deal Now
Note: Don’t miss out — lifetime access ends soon!
FAQ: Your InstaCharts Questions, Answered
Does InstaCharts support live updates?
Yes, charts linked to Google Sheets auto-refresh whenever the sheet updates, keeping your data always current.
Can I import data from Excel or CSV files?
Yes, you can upload Excel or CSV files, but live updating works only with Google Sheets.
How many charts can I create?
The number depends on your AppSumo tier, but even Tier 1 provides generous limits for solo users and small teams.
Are there view limits on shared charts?
No, you can embed or share charts freely without worrying about view quotas.
Is InstaCharts beginner-friendly?
Absolutely, the interface is clean and simple, with step-by-step YouTube tutorials for guidance.
What makes InstaCharts different from Canva or Google Sheets?
It combines instant interactive charts with auto-updating data, merging design and data capabilities in one tool.
Can I embed InstaCharts into WordPress or Notion?
Yes, you can embed charts using a simple iframe or share link on websites, blogs, Notion, and more.
Does InstaCharts support collaboration?
Currently it focuses on solo use, but charts can be shared or embedded for others to view.
Is customer support responsive?
Yes, the team provides active support, with AppSumo buyers receiving priority access.
What happens if the AppSumo deal ends?
Lifetime access remains valid if already redeemed, but you can’t buy the deal again at the same price once it ends.
Is there a learning curve?
Very minimal. If you’re familiar with Google Sheets, InstaCharts feels intuitive and easy to use.
Does it work for large datasets?
For extremely large datasets, it’s not as advanced as enterprise tools, but limits are generous for SMBs and consultants.
Can I try InstaCharts risk-free?
Yes, AppSumo’s 60-day refund guarantee lets you test the tool and get a full refund if it doesn’t fit your needs.
Is InstaCharts only for marketers?
Not at all; educators, consultants, analysts, bloggers, and content creators can all benefit from it.
Why choose InstaCharts over monthly subscription tools?
Because one-time pricing means no recurring fees—you pay once and keep using it indefinitely.
About the Author: Why I Care About Data Storytelling
I’ve spent years helping businesses and creators simplify the way they present information. Too often, I’ve seen brilliant insights get lost inside ugly spreadsheets or unreadable reports. That’s why I’m passionate about tools like InstaCharts — they make data communication simple, beautiful, and impactful.
When I find a lifetime deal that saves money while solving a real-world problem, I get excited to share it with my readers. Because at the end of the day, storytelling with data isn’t just about charts — it’s about making people understand and care about the numbers.
If this review helps you save time, impress clients, or just enjoy working with data a little more, then my mission is accomplished.
Hi, I’m Fahim — a SaaS tools reviewer and digital marketing expert with hands-on experience helping businesses grow using the right software. I research, test, and personally use a wide range of AI, business, productivity, marketing, and email tools for my agency, clients, and projects. I create honest, in-depth reviews and guides to help entrepreneurs, freelancers, startups, and digital agencies choose the best tools to save time, boost results, and scale smarter. If I recommend it, I’ve used it — and I only share what truly works.